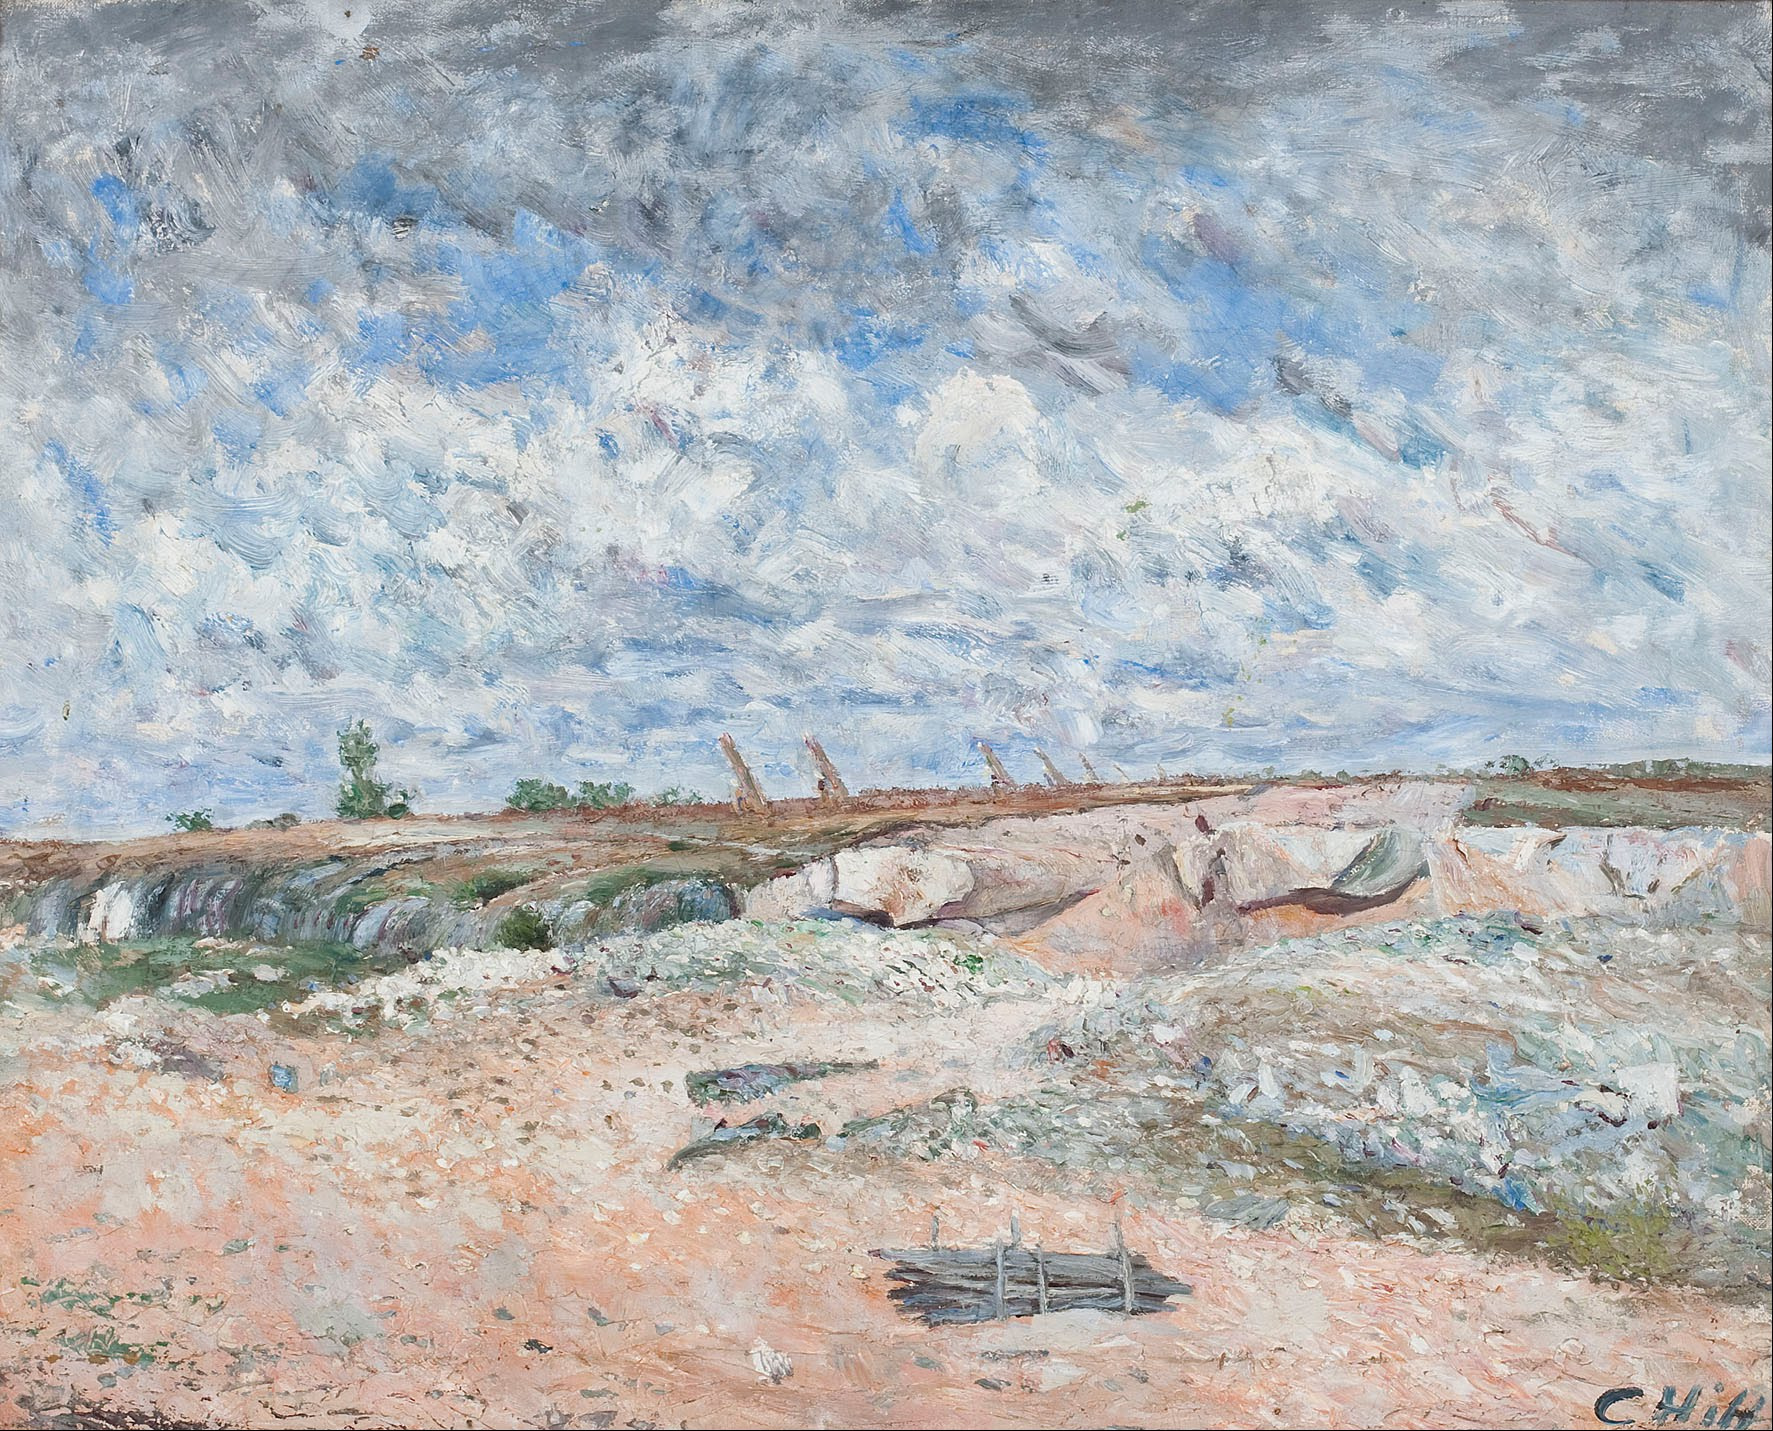
To read signs of climate in art, look at the sky, the season and the air before you look at the story: the colour of a sunset, the presence of ice or snow, the haze around buildings and the kind of weather an artist chose to record. Then test what you see against the date, the place and the scientific record, because paintings can preserve real atmospheric conditions but are also shaped by studio habits, fashion and imagination. Scientists have used old sunsets to estimate volcanic dust and Victorian pictures to track smoke, so a careful viewer can learn to read the same clues, while staying alert to their limits.
Weather and climate are not the same thing
The first step is a distinction. The Met Office describes climate change as a large-scale, long-term shift in the planet’s weather patterns and average temperatures. A single painting almost always records weather: one storm, one frost, one evening. Climate only shows up when you compare many works across years, places and artists.
That matters in a gallery. A snowy scene from 1608 does not prove that every winter of the period was harsh, any more than one hot afternoon proves a trend today. What a single work can do is show you how a particular sky looked to a careful observer, and sometimes it lines up with events we know about from other evidence. Climate reading in art is therefore detective work: the painting is one witness, and you need corroboration.
Colour in the sky as an atmospheric record
The best-known scientific attempt to read climate from paint concerns sunsets. In 2007 C. S. Zerefos of the National Observatory of Athens and colleagues published a study in Atmospheric Chemistry and Physics that measured the ratio of red to green in the skies of a few hundred sunset paintings made between 1500 and 1900. They found a statistically significant correlation coefficient of 0.8 between those red-to-green ratios and the dust veil index, a measure of volcanic dust in the atmosphere. Using a radiative transfer model, they estimated aerosol optical depths ranging from about 0.05 in normal conditions to around 0.6 after the eruptions of Tambora and Krakatau.
A follow-up paper in 2014 went further. The team compared colour-calibrated images of paintings with online reproductions and found the online images gave accurate information. They also asked a painter to record successive sunsets on the Greek island of Hydra while Saharan dust passed overhead, and sun photometers on the spot confirmed that the painter’s red-to-green ratios matched the measured haze. The authors still listed open questions, such as how clouds affect the ratios, and presented their wider conclusion as tentative.
What this gives the ordinary viewer is a habit: when a sunset looks unusually red, orange or yellow, check the date against major eruptions. It is a prompt to investigate, not a verdict.
Volcanic years and the summer that failed
The eruption of Mount Tambora in April 1815 is the classic case. According to the Wikipedia summary of the Year Without a Summer, 1816 brought severe climate abnormalities, with global average temperatures falling by roughly 0.4 to 0.7 °C, crop failures across the Northern Hemisphere and food shortages in Britain and France. The same article notes that tephra in the atmosphere produced spectacular sunsets, and links the yellow tones of J. M. W. Turner’s work to this period.
Turner’s Chichester Canal, c.1828, in the Tate collection is often cited in this debate. If you look at it, notice how the whole sky is suffused with warm light rather than a narrow band of red at the horizon. The painting dates from more than a decade after Tambora, which is a useful reminder: a link between an artwork and a volcanic event needs a plausible time gap, and later works may reflect an artist’s established style as much as any particular sky.
Krakatau, in 1883, offers a second test. Among the theories for the blood-red sky in Edvard Munch’s The Scream is a memory of the vivid sunsets that followed the eruption. Others have proposed nacreous clouds, which occur at the latitude of Norway, and many scholars dispute a literal reading altogether because Munch was an expressive painter. Holding all three explanations in mind at once is exactly the right posture.
Ice, snow and the Little Ice Age
Winter scenes are the second big source of climate clues. Pieter Bruegel the Elder painted The Hunters in the Snow in 1565, as one of a series showing times of the year; the painting hangs in the Kunsthistorisches Museum in Vienna. The Little Ice Age article records that the writer William James Burroughs found depictions of winter clustered almost entirely between 1565 and 1665, and suggested the harsh winter of 1565 prompted original images. The same article reports that Hans Neuberger analysed 12,000 paintings dated between 1400 and 1967 for cloudiness and darkness, finding an increase that peaked between 1600 and 1649.

Pieter Bruegel the Elder, The Hunters in the Snow, 1565, Kunsthistorisches Museum, Vienna. Photo: Pieter Bruegel the Elder (Google Art Project) / Wikimedia Commons, public domain
The caution sits in the same source: winter subjects became less popular after about 1660 without any recorded easing of the winters, which may reflect taste rather than weather. Fashion and markets can make a theme look more or less common than the climate alone would.
Dutch painting gives you the details to look for. The Rijksmuseum’s description of Hendrick Avercamp’s winter scene with ice skaters, c. 1608 points out that hundreds of people are on the ice, most for pleasure and some out of necessity, and that crows and a dog feed on the carcass of a horse that has frozen to death in the left foreground. That grim detail tells you more about the severity of the cold than the skaters do.
In London, the equivalent evidence is the frost fair. The history of the River Thames frost fairs lists recorded fairs in 695, 1608, 1683 to 1684, 1716, 1739 to 1740, 1789 and 1814, the last one. It also notes that from 1400 until the old London Bridge was removed in 1831, the Thames was recorded frozen at London in 24 winters, and that the bridge’s 19 piers slowed the river. So a frozen Thames in a print is partly a record of cold and partly a record of engineering. Reading a climate sign properly means asking what else was different.
Smoke, fog and the industrial sky
Some of the clearest changes in old pictures were made by people rather than volcanoes. The National Gallery’s entry for Turner’s Rain, Steam, and Speed, 1844 describes a train crossing Brunel’s Maidenhead Railway Bridge, completed in 1838, in driving rain, with a hare once painted on the track as a contrast between natural and mechanised speed. Weather, steam and smoke merge into one atmosphere.
Claude Monet’s London views push the idea further. According to the account of his Houses of Parliament series, Monet returned to London in 1899, painted from the Savoy Hotel and worked in the city periodically until 1905, drawn above all by its fogs. Analyses of solar position reported in 2006 suggested the paintings contain elements of accurate observation.
In 2023 Anna Lea Albright and Peter Huybers published a study in PNAS arguing that the shift from figurative to impressionistic treatment in Turner’s and Monet’s paintings tracks local sulphur dioxide emissions, with hazier contours and a whiter palette consistent with heavier aerosol pollution. The paper drew a direct response. Michael Marmor, an emeritus ophthalmologist at Stanford, wrote a reply arguing that most of these paintings show stylistic evolution, not pollution, noting that both artists also painted late works with clear blue skies and that Monet visited London only in 1870 to 1871 and 1899 to 1901. Read together, the two papers are a model of how to weigh evidence from paint.
Observation, studio and invention
Before you treat any sky as data, ask how it was made. John Constable is the obvious test case. His biography records that he wrote “I have done a good deal of skying” in a letter of 23 October 1821, and that his annotated copy of a meteorology book shows he knew the scientific terms for clouds (John Constable on Wikipedia). Tate holds one of his oil sketches titled Cloud Study, dated 1822, the kind of rapid outdoor study that comes closest to a weather observation.
Yet his most famous picture is a composite. The National Gallery explains that The Hay Wain, 1821, shows a changeable Suffolk summer sky with one ominous raincloud, but was painted in his London studio from open-air sketches made over several years. Its sky is accurate in character, not necessarily in date. The same entry notes that the factories and locomotives found in Turner’s work are absent from Constable’s, which is itself a choice about what to leave out.
Contemporary work that makes climate the subject
Many living artists have stopped waiting for climate to appear in the background and put it at the centre. Olafur Eliasson’s Ice Watch is a clear example. As described on the artist’s Ice Watch page, the work was shown in Copenhagen in 2014, at the Place du Panthéon in Paris in 2015, and in London in 2018 on Bankside outside Tate Modern and in the City. The Wikipedia account of Eliasson’s practice says that the first version brought twelve blocks of ice from the Nuup Kangerlua fjord in Greenland, each weighing between 1.5 and 5 tonnes, timed to coincide with climate conferences and reports. Here the material itself is the sign: you watch the ice melt.
With work like this, the reading task changes. You are less often decoding a hidden clue and more often asking what the artist wants you to notice, what evidence they draw on, and how the piece was made and documented.
A checklist for your next gallery visit
Use these questions in front of any work, old or new:
- What date and place are given on the label, and were there known events nearby in time, such as a major eruption or a famous freeze?
- Is the sky colour unusual for the time of day shown, and is the effect spread across the whole sky or confined to the horizon?
- Is there ice, snow, flood or drought, and are there details, like Avercamp’s frozen horse, that show its severity?
- Was the work painted outdoors, or assembled in a studio from sketches over years?
- Does the artist’s style change over the same period, which could explain haze or brightness without any change in the air?
- Is there human infrastructure, such as a bridge, chimney or railway, that altered the scene or the atmosphere?
- Do several works from the same years and region show the same feature, or is this one picture on its own?
If you want to practise, start with collection pages: the Tate, the National Gallery and the Rijksmuseum all publish dates and descriptions online that you can read alongside the scientific papers above. Our independent coverage and our gallery in Ruthin are introduced on the Visionary Art homepage, and wider arts writing appears at Art Culture. The most useful habit is simple: enjoy the sky first, then check it against the record.
Photo: Carl Fredrik Hill, Public domain, via Wikimedia Commons